Philosophy Overview
Our default posture is to match the global market portfolio as the baseline. Any deviation from that baseline is treated like tracking error and must be justified with a clear, long-horizon rationale.
Benchmark Context For Canadian Investors
Most advisors describe risk profiles using broad stock/bond splits:
- Conservative: 40% stocks / 60% bonds
- Moderate: 60% / 40%
- Aggressive: 80% / 20%
Those labels are useful, but they do not describe how portfolios are allocated within equities and fixed income. To estimate the real-world benchmark, we look at Canadian asset allocation funds and balanced funds as a proxy for how the industry actually allocates capital.
Based on the OSC Investment Fund Survey and a broader dataset of balanced funds, asset allocation funds represent a meaningful share of Canadian investor assets. Within those funds, global neutral balanced is the largest category, and large platforms (for example, RBC balanced portfolios) account for a sizable share of AUM.
There are two broad classifications for Canadian allocation funds:
Canadian Allocation Funds
Must keep at least 70% of assets in Canadian equities and Canadian-dollar fixed income. Equity balanced funds are roughly 70% equities, neutral funds around the mid‑50s, and fixed income focused funds near 30%. These funds also hold a notable cash sleeve.Global Allocation Funds
Hold less than 70% of assets in Canada. These portfolios tend to be slightly more equity‑tilted in the equity and fixed income categories, while neutral portfolios are slightly less.
Within fixed income, holdings skew toward investment‑grade credit with somewhat higher corporate exposure than government. Duration tends to be in a mid‑range (roughly five to seven years), and average yield to maturity has been in the mid‑single digits. On the equity side, global portfolios broadly track cap‑weights, but Canada‑focused portfolios exhibit a pronounced North American bias.
The result is a strong home‑country tilt across most Canadian balanced portfolios. Global funds tend to hold roughly half of their equity in the U.S., around a quarter to a third in Canada, with the remainder international.
What We Aim To Do
- Anchor portfolios to broad global market exposures.
- Minimize unnecessary divergence from the baseline.
- Measure any deviation explicitly and monitor it like risk.
- Prefer changes that improve resilience without relying on short-term forecasts.
Where We May Deviate
One example is international diversification. Over long horizons, equities across countries tend to deliver similar returns, so we view broader global exposure as a prudent way to reduce concentration risk relative to a market-portfolio anchor.
Asset Allocation Models
The models below reflect a baseline structure with measured differences. They are starting points and are refined based on client-specific tax, liquidity, and risk constraints.
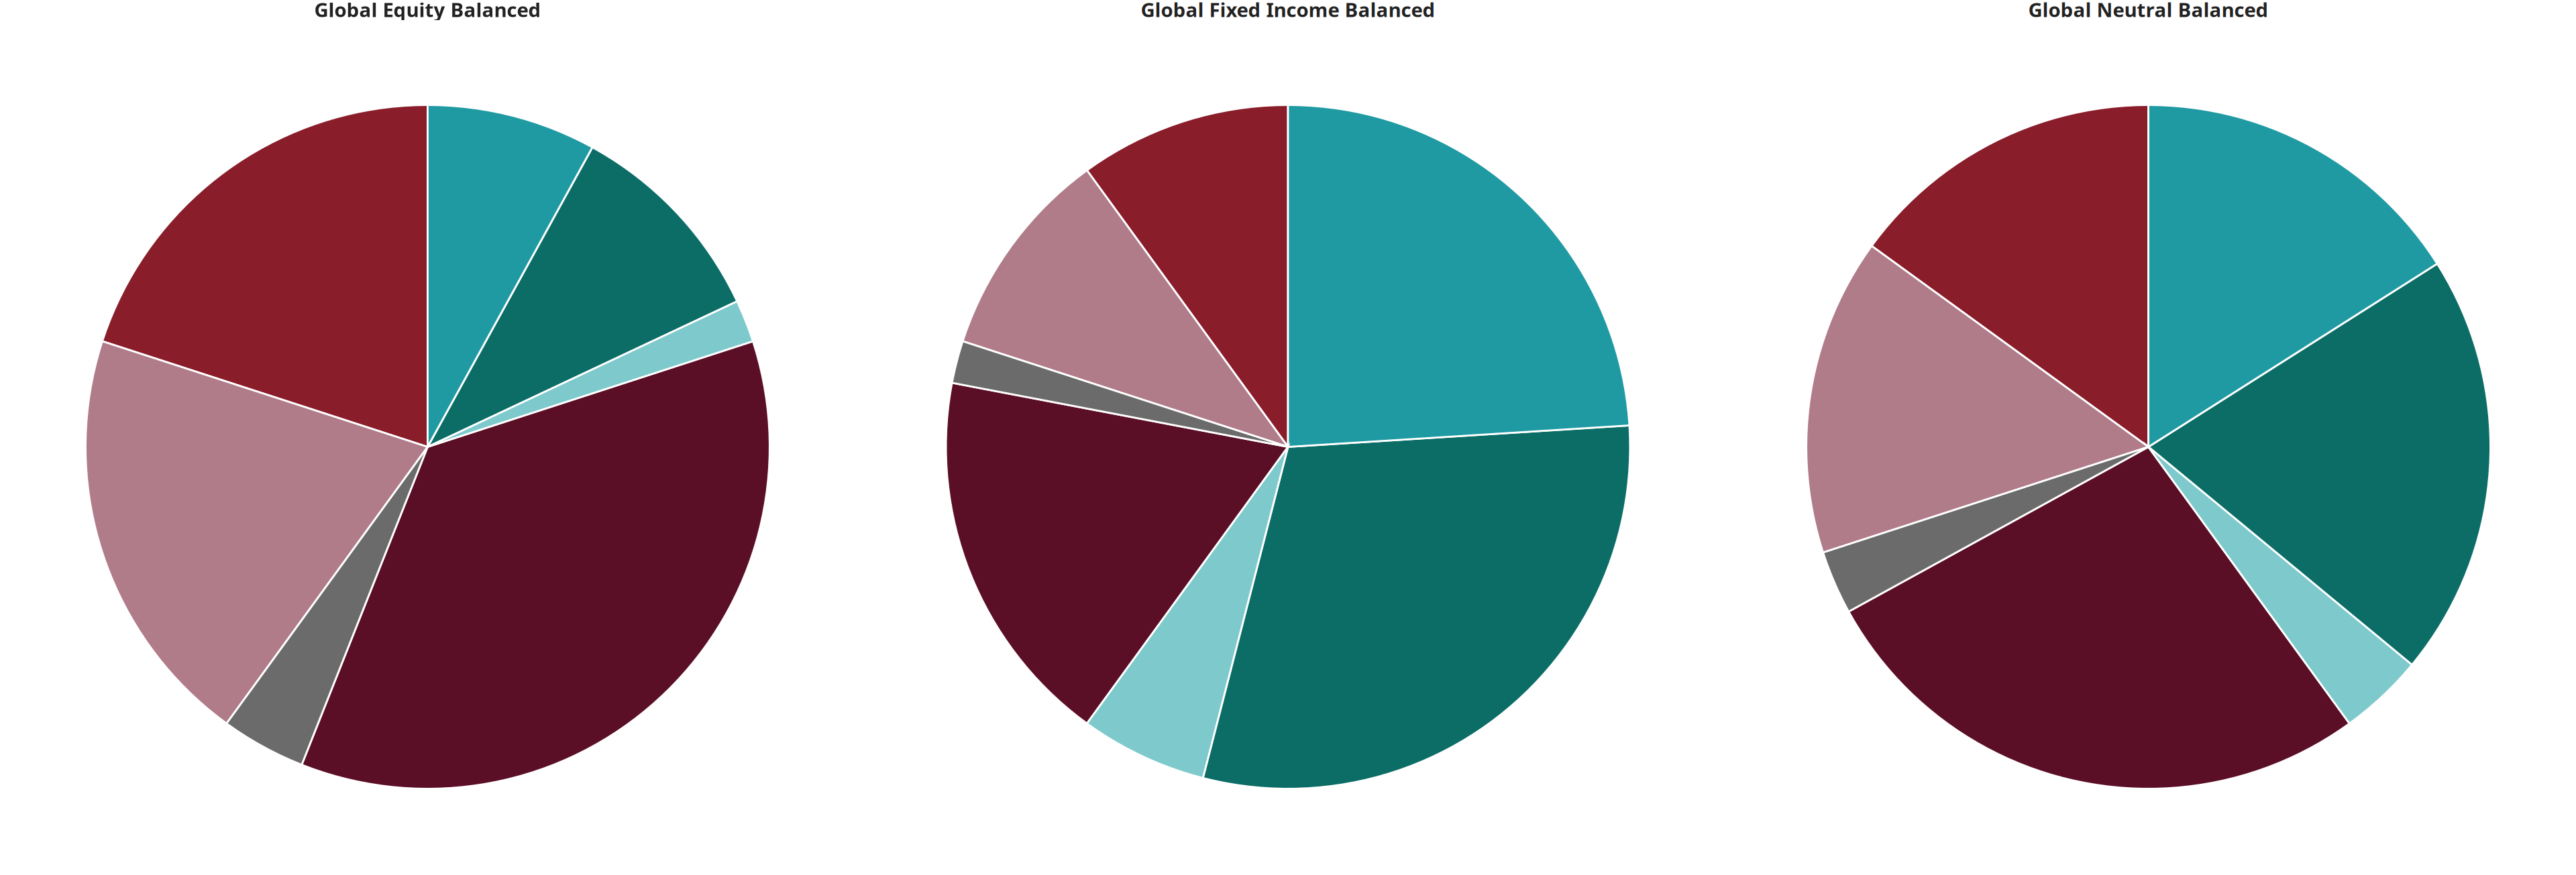
Global Balanced Models
| Asset Class | Global Fixed Income Balanced | Global Neutral Balanced | Global Equity Balanced |
|---|---|---|---|
| Equity: Canada | 10% | 15% | 20% |
| Equity: United States | 18% | 27% | 36% |
| Equity: Developed | 10% | 15% | 20% |
| Equity: Emerging | 2% | 3% | 4% |
| Fixed Income: Corporate | 30% | 20% | 10% |
| Fixed Income: Government | 24% | 16% | 8% |
| Fixed Income: Cash | 6% | 4% | 2% |
Governance And Discipline
- Changes must be intentional, documented, and measurable.
- Every tilt is evaluated as a cost: higher tracking error must earn its keep.
- We prioritize transparency so clients can understand what is different and why.